Red Gate Dependency Tracker - Making Databases Into Moving Art
data structures are art
If anyone thinks that working with complex data structures is boring… I don’t know what world they live in. The problem is often that sql tables and data structures are just script files and lists of tables in an object explorer.
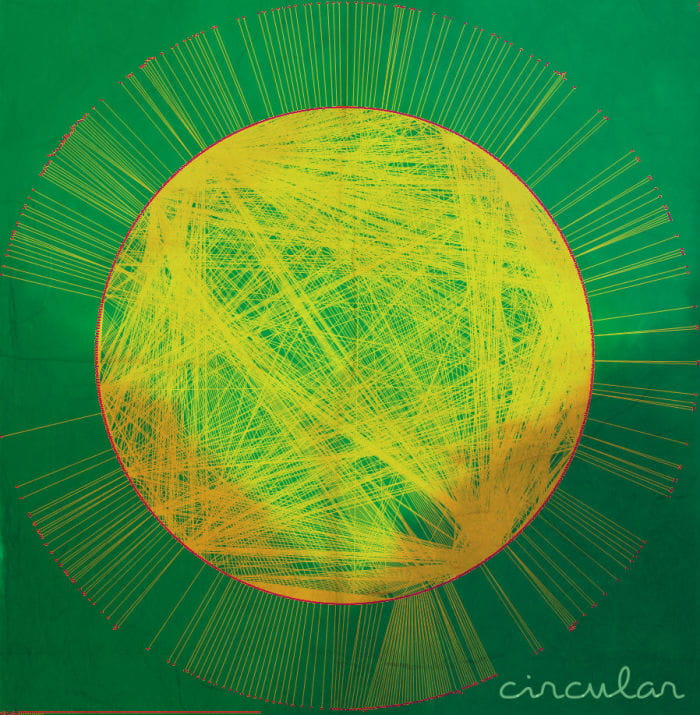
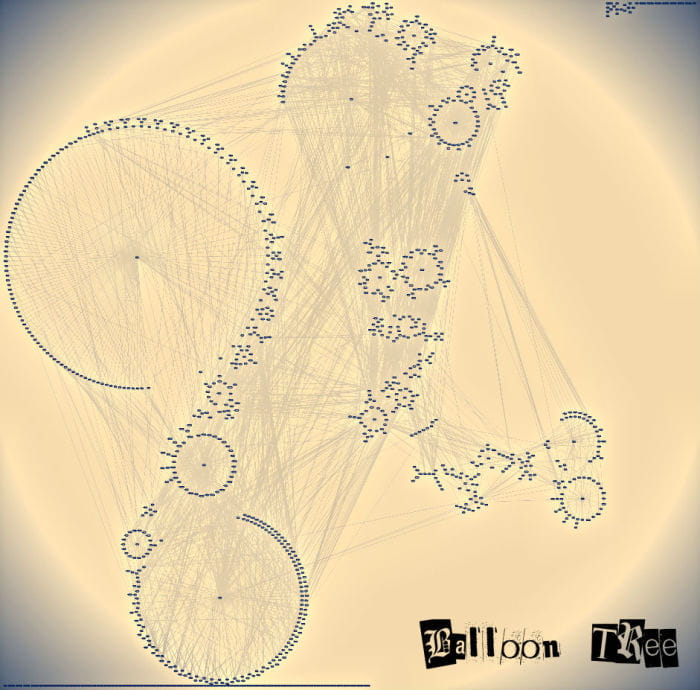
However, once you crack open the visual aspect of database diagramming and data architecture, you can see some interesting patterns emerge.red gate dependency viewer tracker
I’ve long enjoyed playing around with Red Gate Dependency Tracker. I’ve found it a great tool for interacting with dependencies and visually working through their relationships. I figured I’d share with others a more artistic side of database architecture, as I’ve never seen it done, and I found it uniquely beautiful.
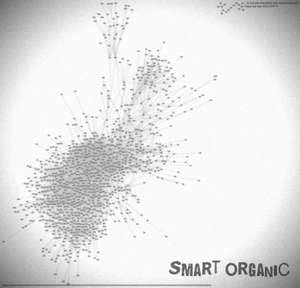
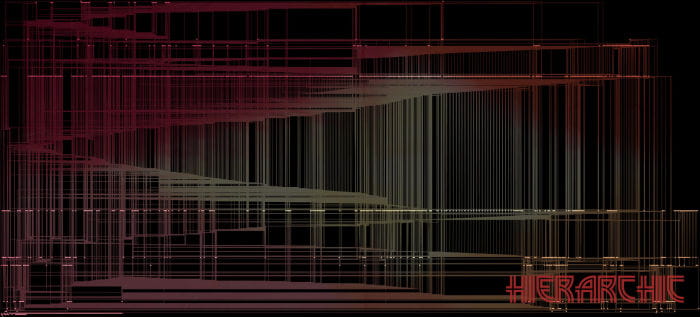
visual review of data structures
This is the architecture of the application I work on everyday. I inherited care of a system that shows the attention and design that was put into it. The order of the key relationships is obvious. I’ve worked on some systems that this diagram would be completely different story without the order and structure. The interesting part about the visual dependency view is you can often see orphaned objects that aren’t correctly linked to their parent objects, so it can serve as a useful tool to help improve existing designs. My previous article about tools I’ve use for this is here…Documenting Your Database with Diagrams Enjoy!
Webmentions