
Diagrams as Code
Why
It’s not for everyone.
I prefer to write diagrams out logically and then let the visual aspect be generated.
This helps me by making the visual presentation an artifact of what is basically a written outline.
Presentation Matters
I’ve learned that communicating flows of information can often be better presented visually than trying to write them out, especially once it involves more than a few “nodes” of responsibility. Visualizing a complicated process can be done more easily in a visual way, as well as help expose some possible issues when ownership is transfered between lanes too many times.
Options
LucidChart, Draw.io and other tools are great for a quick solution.
Mermaid also provides a nice simple text based diagramming tool that is integrated with many markdown tools.
For me, this just never fit. I like a bit of polish and beauty in a visual presentation and most of these are very utilitarian in their output.
I came across diagrams1 and found it a perfect fit for intuitive and beautiful diagram rendering of cloud architecture, and figured it would be worth a blog post to share this.
Getting Started
Install Poetry2 and create a new poetry project in your directory using poetry init.
Once it gets to the package additions add diagrams to your poetry file.
Run poetry install
Finally, create a new file called diagram.py in your directory.
Once you populate this file, you can run your diagram using the virtual env it manages by calling poetry run python diagram.py.
Additionally, any command line arguments you want to pass would just go through like poetry run python diagram.py --outdirectory foobar
Diagrams
The documentation is pretty thorough, but detailed examples and shortcuts are very hard to find. You’ll have to dig through the repo issues on occasion if you find yourself wanting to do something that isn’t obvious. This project seems to be a wrapper around graphviz, so a lot of the documentation for parameters and customizations will be in it’s documentation, not in this project.
To find available nodes and shapes, you’ll need to look at the diagram docs3
Simple Example
Using defaults you can create a simple diagram such as this:
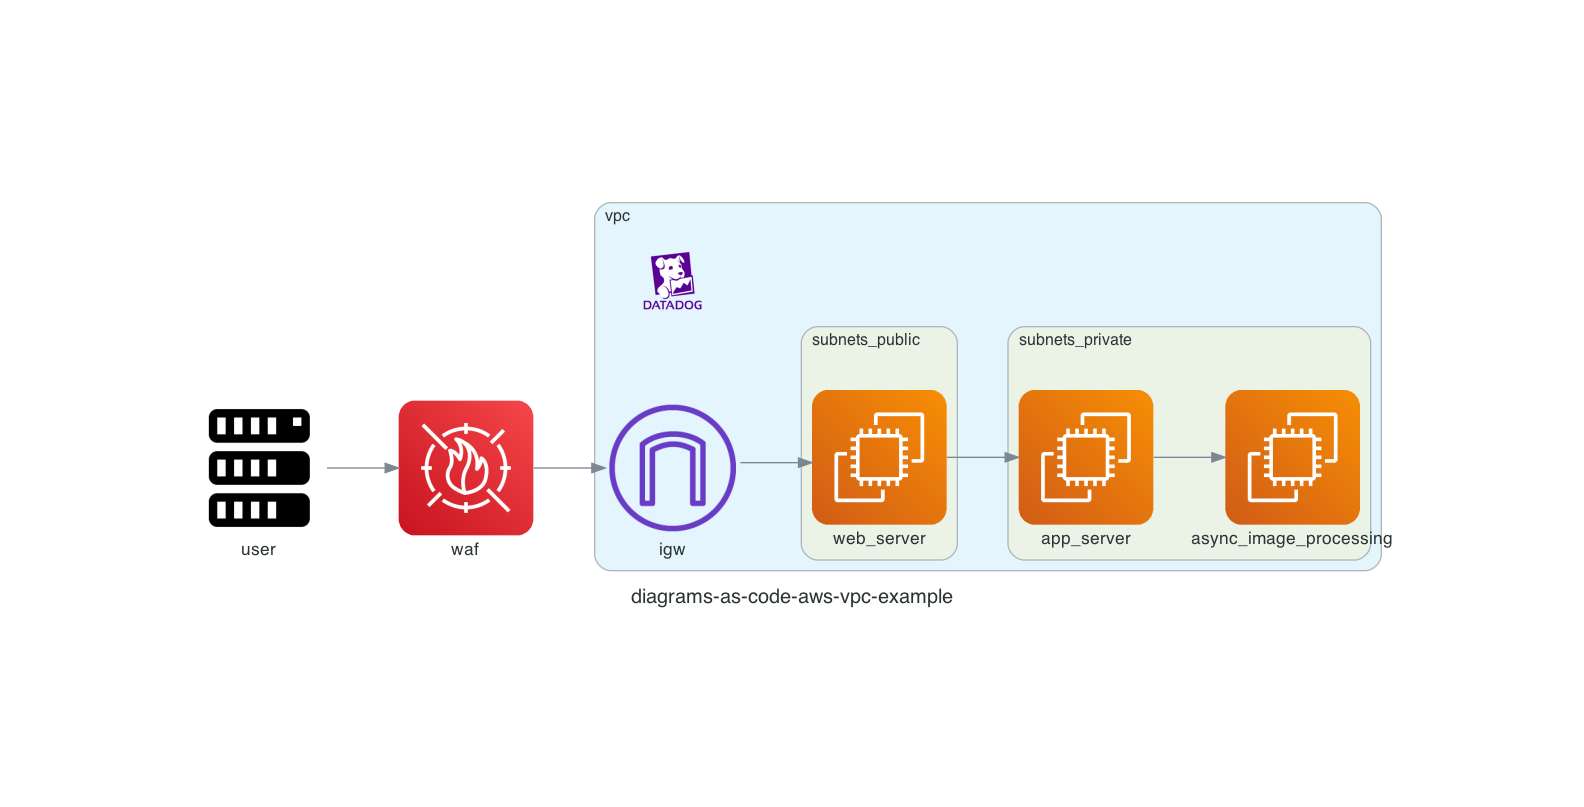
import argparse, sys, os
from diagrams import Cluster, Diagram, Edge
from diagrams.aws.compute import ECS, Fargate,EC2
from diagrams.aws.network import (
    VPC,
    PrivateSubnet,
    PublicSubnet,
    InternetGateway,
)
from diagrams.aws.security import WAF
from diagrams.onprem.compute import Server

#######################################################
# Setup Some Input Variables for Easier Customization #
#######################################################
title = "diagrams-as-code-aws-vpc-example"
outformat = "png"
filename = "out/diagrams-as-code-aws-vpc-example"
filenamegraph = "out/diagrams-as-code-aws-vpc-example.gv"
show = False
direction = "LR"
smaller = "0.8"


with Diagram(
    name=title,
    direction=direction,
    show=show,
    filename=filename,
    outformat=outformat,
) as diag:
    # Non Clustered
    waf = WAF("waf")
    user = Server("user")

    # Cluster = Group, so this outline will group all the items nested in it automatically
    with Cluster("vpc"):
        igw_gateway = InternetGateway("igw")

        # Subcluster for grouping inside the vpc
        with Cluster("subnets_public"):
            ec2_server_web_server = EC2("web_server")
        # Another subcluster equal to the subnet one above it
        with Cluster("subnets_private"):
            ec2_server_app_server = EC2("app_server")
            ec2_server_image_processing = EC2("async_image_processing")

    # Now I document the flow here for clarity
    # Could do it in each node area, but I like the "connection flow" to be at the bottom
    ###################################################
    # FLOW OF ACTION, NETWORK, or OTHER PATH TO CHART #
    ###################################################
    user >> waf >> igw_gateway >> ec2_server_web_server >> ec2_server_app_server >> ec2_server_image_processing

diag
Add Some Helpers
From the github issues and my own customizations, I added a few additions to make the edge (ie, lines) flow easier to work with.
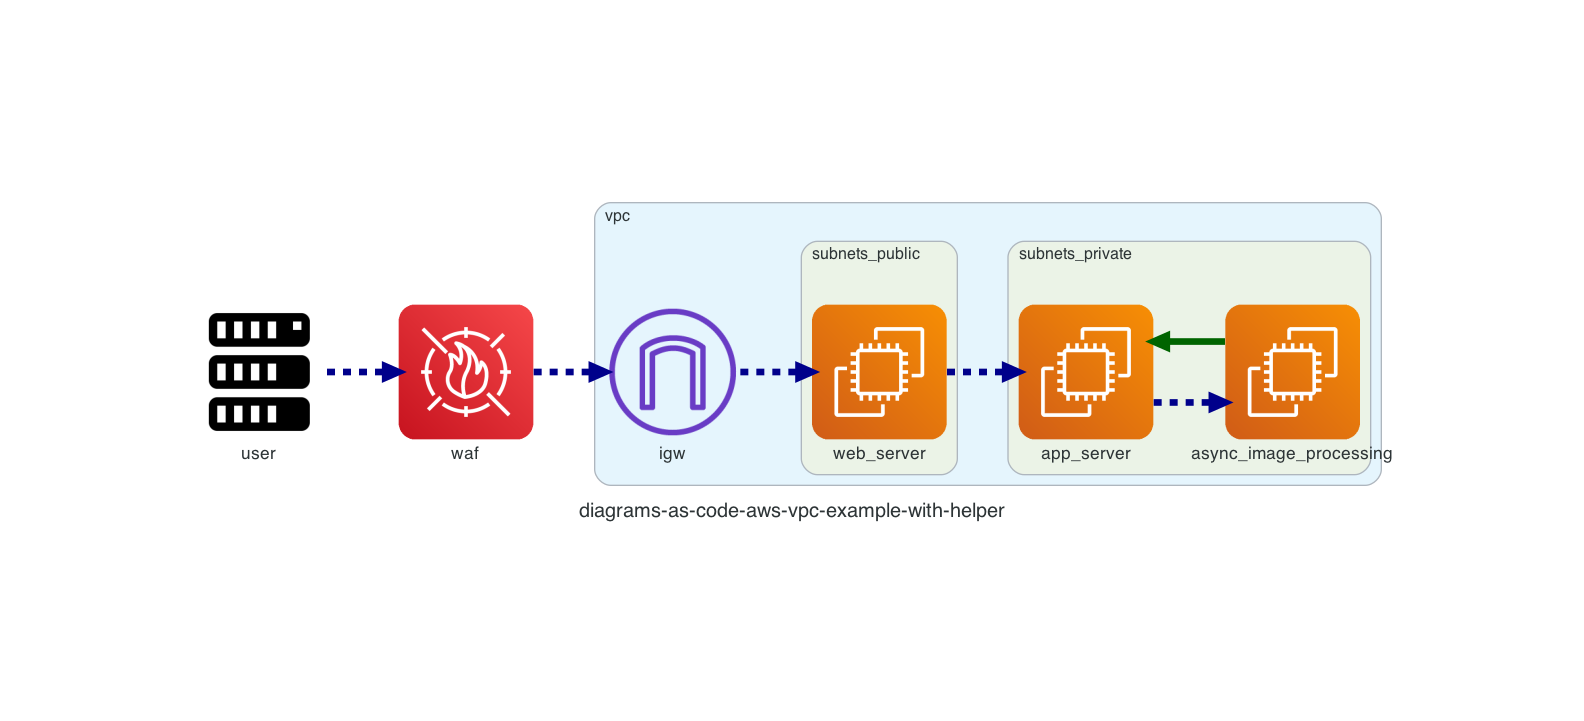
# Add argument and path packages to help with passing in arguments via command line
import argparse, sys, os
from pathlib import Path

# Simplify optional argument parsing with a coalesce function
def coalesce(*arg):
    for el in arg:
        if el is not None:
            return el
    return None

# Generate a line by providing the nodes to connect in a list.
# Style the lines and color to make it easier to trace several different paths on the same graph
def colored_flow(nodes, color="black", style="", label=""):
    print(f"==> def colored_flow: nodes {nodes}")
    for index, n2 in zip(nodes, nodes[1:]):
        print(f"\t----> {index.label} >> Edge(label={label}) >> {n2.label}")
        index >> Edge(label=label) >> Edge(color=color, style=style) >> n2
    print("completed with colored_flow")
A More Complex Example
I went through the AWS Reference Architecture Diagrams 4 and used this to provide a more complex example.
Take a look at the AWS PDF5 and compare.
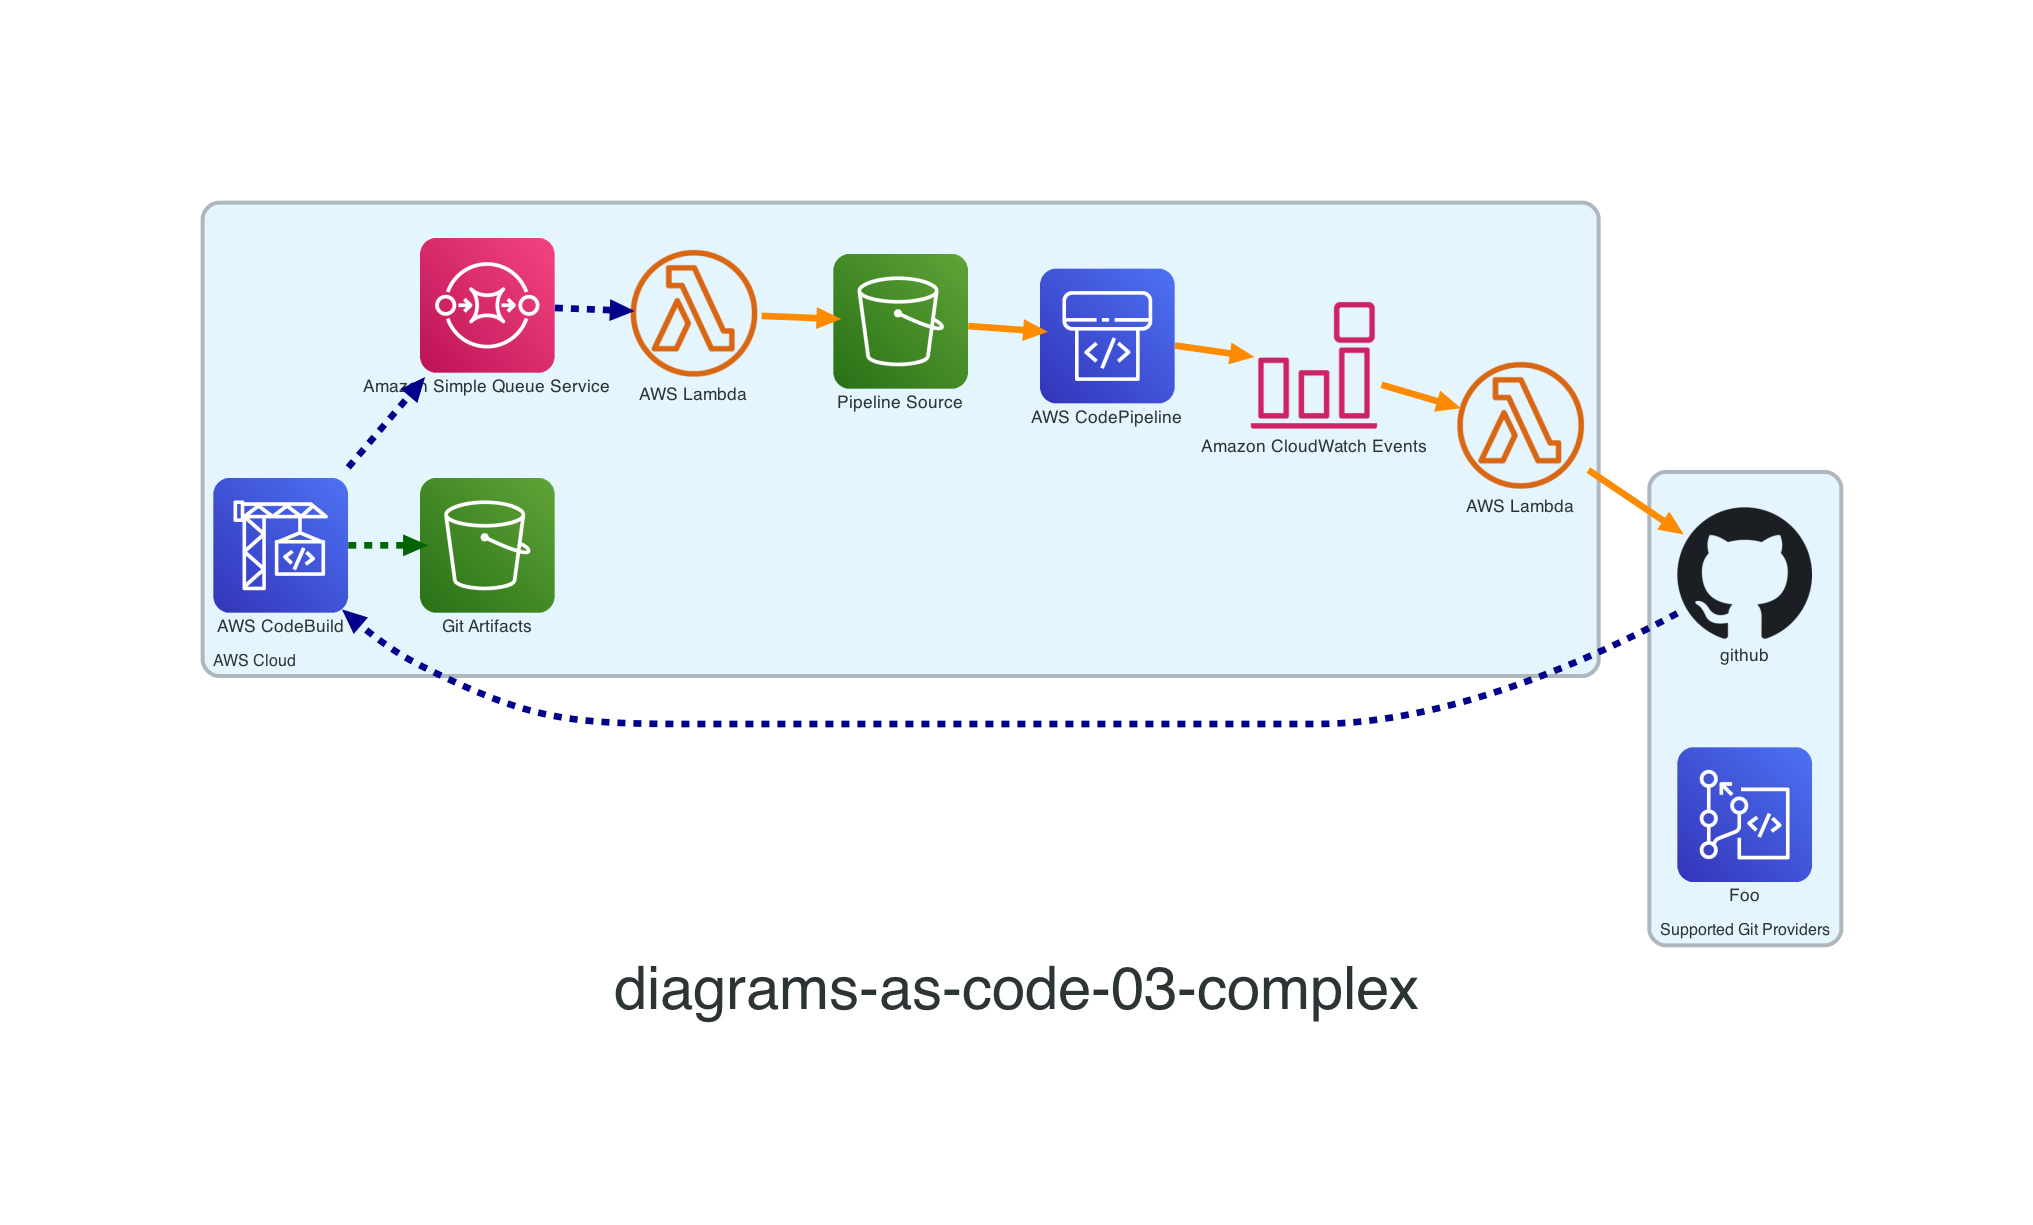
from diagrams import Cluster, Diagram, Edge
from diagrams.aws.devtools import Codebuild,Codepipeline,Codecommit
from diagrams.aws.storage import S3
from diagrams.aws.integration import SQS
from diagrams.aws.management import CloudwatchEventEventBased
from diagrams.aws.compute import LambdaFunction
from diagrams.onprem.vcs import Github
from diagrams.generic.blank import Blank


# Add argument and path packages to help with passing in arguments via command line
import argparse, sys, os
from pathlib import Path

# Simplify optional argument parsing with a coalesce function
def coalesce(*arg):
    for el in arg:
        if el is not None:
            return el
    return None

# Generate a line by providing the nodes to connect in a list.
# Style the lines and color to make it easier to trace several different paths on the same graph
def colored_flow(nodes, color="black", style="", label=""):
    print(f"==> def colored_flow: nodes {nodes}")
    for index, n2 in zip(nodes, nodes[1:]):
        print(f"\t----> {index.label} >> Edge(label={label}) >> {n2.label}")
        index >> Edge(label=label) >> Edge(color=color, style=style) >> n2
    print("completed with colored_flow")

############################################
# Attributes (LOTS OF EXPERIMINATION HERE) #
############################################

graph_attr = {
    "imagescale": "true",  # true | false | width | height | both
    "fixedsize": "true",  # true | false
    "fontsize": "45",
    "remindcross": "true",
    # "bgcolor": "transparent",
    "bgcolor": "white",
    # "splines": "polyline",
    # "splines": "lines",
    "splines": "splines",
    # "splines": "ortho",
    # "splines": "curved",
    # "splines": "curved",
    # "splines": "compound",
    # "splines": "true",
    "overlap": "false",
    "arrowsize": "10",
    "penwidth": "3",
    # "penwidth": "0",
    # "width": "0.8",
    # "height": "0.8",
    "ratio": "compress",
    # "labeldistance":"10.0",
    "overlap": "scale",
    "overlap_shrink": "true",
    "labelloc": "b",
    "concentrate": "true",
    # "repulsiveforce": "10.0",
    # "rankdir": "LR",
    # "color": "darkblue",
    # "labelfontsize": "18.0",
    # "labelloc":"c",
    # "labelfloat": "false",
    # "layout":"neato",
    # "layout":"fdp",
    # "pack": "true",
}

################################
# PARSE COMMAND LINE ARGUMENTS #
################################
project_directory = os.path.dirname(os.getcwd())
artifact_directory = os.path.join(project_directory, "static","images")
print(f"artifact_directory      : {artifact_directory}")

parser = argparse.ArgumentParser()
parser.add_argument("--filename", help="output file name. Do not include the extension")
parser.add_argument("--outformat", help="default png")
args = parser.parse_args()
outformat = coalesce(args.outformat, "png")

filename = os.path.join(
    artifact_directory, coalesce(args.filename, "diagrams-as-code-03-complex")
)
filenamegraph = os.path.join(
    artifact_directory, coalesce(args.filename, "diagrams-as-code-03-complex.gv")
)
print(f"outformat     : {outformat}")
print(f"filename      : {filename}")
print(f"filenamegraph : {filenamegraph}")

#######################################################
# Setup Some Input Variables for Easier Customization #
#######################################################
title = "diagrams-as-code-03-complex"
show = True
direction = "LR"
smaller = "0.8"

with Diagram(
    name=title,
    direction=direction,
    show=show,
    graph_attr=graph_attr,
    filename=filename,
    outformat=outformat,
) as diag:
    with Cluster("Supported Git Providers"):
        github = Github("github")
        codecommit = Codecommit("Foo")
    with Cluster("AWS Cloud"):
        codebuild = Codebuild("AWS CodeBuild")
        codepipeline = Codepipeline("AWS CodePipeline")
        git_artifacts = S3("Git Artifacts")
        s3_pipeline_source = S3("Pipeline Source")
        sqs = SQS("Amazon Simple Queue Service")
        lambda_function = LambdaFunction("AWS Lambda")
        lambda_function_2 = LambdaFunction("AWS Lambda")
        cloudwatch_events = CloudwatchEventEventBased("Amazon CloudWatch Events")

    colored_flow(
        nodes=(github , codebuild, sqs , lambda_function
        ),
        color="darkblue",
        style="dashed,setlinewidth(5)",
    )
    colored_flow(
        nodes=(codebuild,git_artifacts
        ),
        color="darkgreen",
        style="dashed,setlinewidth(5)",
    )
    colored_flow(
        nodes=(lambda_function, s3_pipeline_source , codepipeline, cloudwatch_events, lambda_function_2, github),
        color="darkorange",
        style="solid,setlinewidth(5)",
    )

diag
Reference
| Graphviz Reference |
|---|
| Colors |
| Available Nodes |
| Individual Node Edits |
| Reference for Graph Attributes |