Quick Start to Using Influxdb on Macos
Intro
OSS 2.0 is a release candidate at this time, so this may change once it’s released.
It wasn’t quite clear to me how to get up and running quickly with a docker based setup for OSS 2.0 version, so this may save you some time if you are interested. It also should be very similar to the Windows workflow excepting the basic brew commands and service install commands you’ll just want to flip over to choco install telegraf .
Docker Compose
Grabbed this from a comment and modified the ports as the were flipped from the 9999 range used during first early access.
# docker exec -it influxdb /bin/bash

version: "3.1"
services:
  influxdb:
    restart: always  # It will always restart on rebooting machine now, no need to manually manage this
    container_name: influxdb
    ports:
      - '8086:8086'
    images: ['quay.io/influxdb/influxdb:2.0.0-rc']
    volumes:
      - influxdb:/var/lib/influxdb2
    command: influxd run --bolt-path /var/lib/influxdb2/influxd.bolt --engine-path /var/lib/influxdb2/engine --store bolt
volumes:
  influxdb:
The main modifications I made was ensuring it auto started.
Access the instance on localhost:8086.
Telegraf
It’s pretty straight-forward using homebrew. brew install telegraf
The configuration file is created by default at: /usr/local/etc/telegraf.conf as well as the telegraf.d directory.
I’m still a bit new on macOS, so once I opened Chronograf, I wanted to try the new http based configuration endpoint, so I used the web gui to create a telegraf config for system metrics and tried replacing the telegraf.conf reference in the plist file.
This didn’t work for me as I couldn’t get the environment variable for the token to be used, so I ended up leaving it as is, and instead edited the configuration.
brew services stop telegrafmicro /usr/Local/Cellar/telegraf/1.15.3/homebrew.mxcl.telegraf.plist
I updated the configuration (see line 16) unsuccessfully with the http config endpoint.
<?xml version="1.0" encoding="UTF-8"?>
<!DOCTYPE plist PUBLIC "-//Apple//DTD PLIST 1.0//EN" "http://www.apple.com/DTDs/PropertyList-1.0.dtd">
<plist version="1.0">
  <dict>
    <key>KeepAlive</key>
    <dict>
      <key>SuccessfulExit</key>
      <false/>
    </dict>
    <key>Label</key>
    <string>homebrew.mxcl.telegraf</string>
    <key>ProgramArguments</key>
    <array>
      <string>/usr/local/opt/telegraf/bin/telegraf</string>
      <string>-config</string>
      <string>/usr/local/etc/telegraf.conf</string>
      <string>-config-directory</string>
      <string>/usr/local/etc/telegraf.d</string>
    </array>
    <key>RunAtLoad</key>
    <true/>
    <key>WorkingDirectory</key>
    <string>/usr/local/var</string>
    <key>StandardErrorPath</key>
    <string>/usr/local/var/log/telegraf.log</string>
    <key>StandardOutPath</key>
    <string>/usr/local/var/log/telegraf.log</string>
  </dict>
</plist>
What worked for me was to edit: micro /usr/local/etc/telegraf.conf and add the following (I set the token explicitly in my test case).
 [[outputs.influxdb_v2]]
  urls = ["http://localhost:8086"]
  token = "$INFLUX_TOKEN"
  organization = "sheldonhull"
bucket = "telegraf"- Start service with
brew services restart telegrafand it should start sending data. - NOTE: I’m still getting the hang of brew and service management on Linux/macOS, so the first time I did this it didn’t work and I ended up starting it using
telegraf -config http://localhost:8086/api/v2/telegrafs/068ab4d50aa24000and just running initially in my console (having already set theINFLUX_TOKENenvironment variable) Any comments on if I did something wrong here would be appreciated :grin: I’m pretty sure the culprit is the need for theINFLUX_TOKENenvironment variable and I’m not sure if the service load with brew is actually sourcing the.profileI put this in. Maybe I can pass it explicitly?
Additional Monitoring
This is a work in progress. I found GitHub Issue #3192 and used it as a starting point to experiment with getting a “top processes” for evaluating what specifically was impacting my systems at the time of a spike. I’ll update this once I’ve gotten things further improved.
# # Monitor process cpu and memory usage
# https://github.com/influxdata/telegraf/tree/master/plugins/inputs/procstat
[[inputs.procstat]]
pattern = "${USER}"
fieldpass = [
"cpu_time_user",
"cpu_usage",
"memory_rss",
]
[[processors.topk]]
namepass = ["*procstat*"]
fields = [
"cpu_time_user",
"cpu_usage",
"memory_rss",
]
period = 20
k = 3
# group_by = ["pid"]
[[processors.regex]]
namepass = ["*procstat*"]
[[processors.regex.tags]]
key = "process_name"
pattern = "^(.{60}).*"
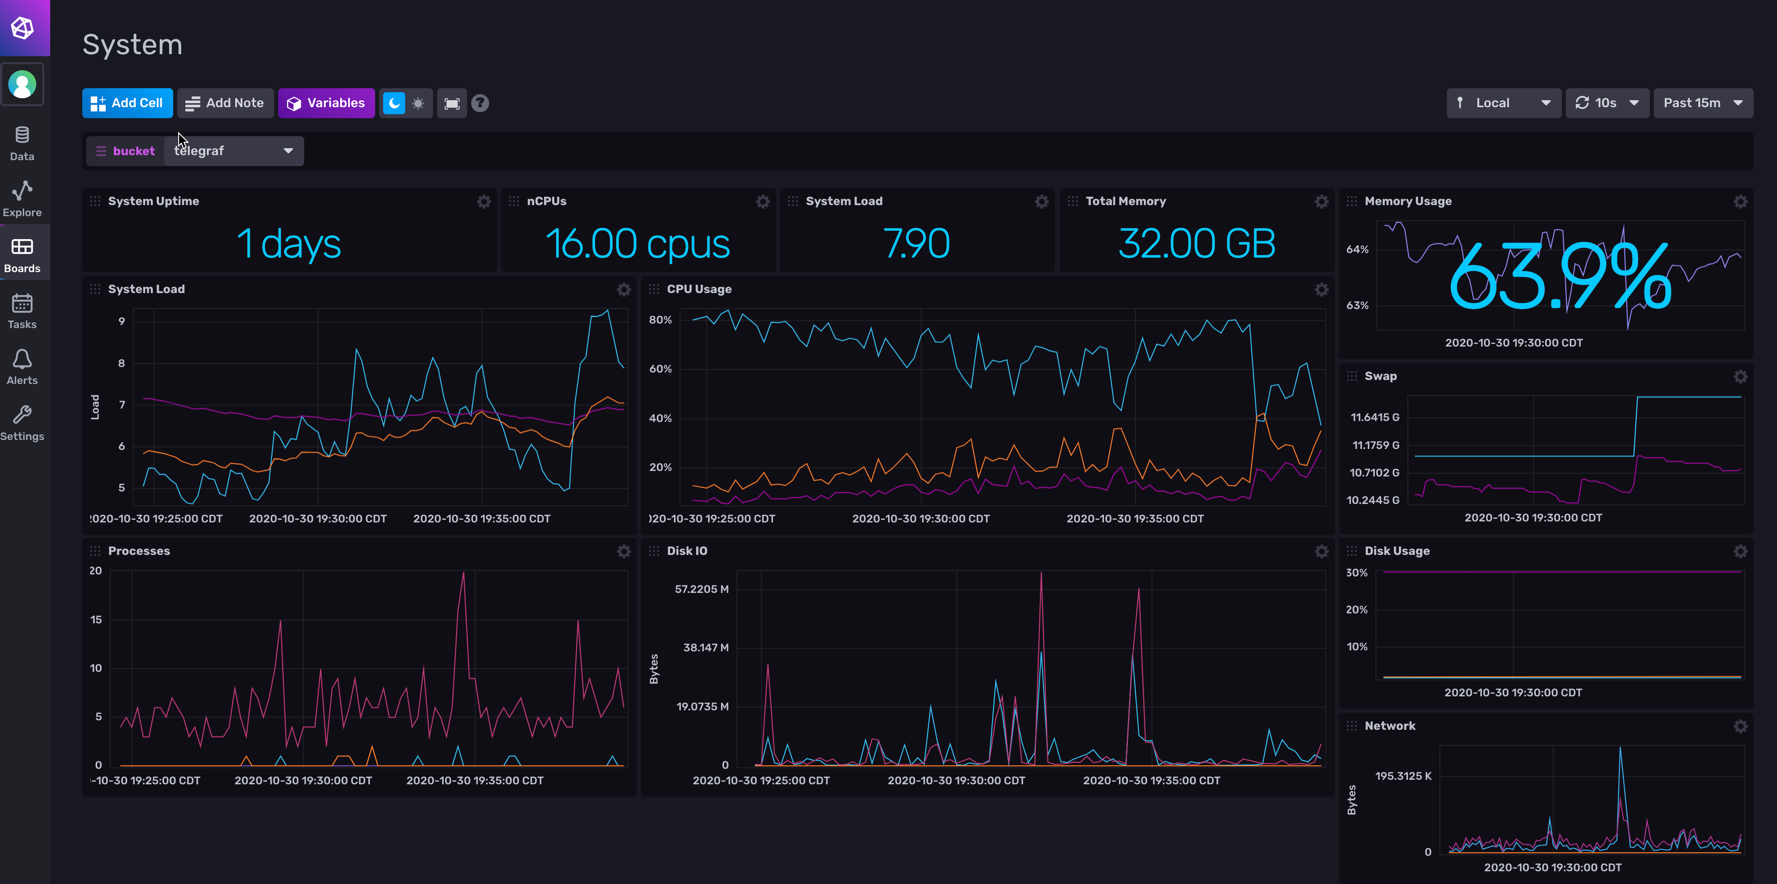
replacement = "${1}..."Final Result
I like the final result. Dark theme for the win.
I’ve had some spikes in Vscode recently, impacting my CPU so I’ve been meaning to do something like this for a while, but finally got it knocked out today once I realized there was a 2.0 docker release I could use to get up and running easily. Next step will be to add some process level detail so I can track the culprit (probably VScode + Docker Codespaces).
Wishlist
- Pretty formatting of date/time like Grafana does, such as converting seconds into hour/minutes.
- Log viewing api so I could query cloudwatch logs like Grafana offers without needing to ingest.
- Edit existing telegraf configuration in the load data section. Right now I can’t edit.
- MSSQL Custom SQL Server query plugin to be released :grin: Issue 1894 & PR 3069 Right now I’ve done custom exec based queries using dbatools and locally included PowerShell modules. This sorta defeats the flexibility of having a custom query call so I can minimize external dependencies.