Monitoring SQL Server on a budget
Cheap ain’t easy
There’s a lot of tools out there, and very few that are polished, have a good UI, and some reasonable functionality to help monitoring, that don’t cost an arm and a leg. One such tool I’ve recently begun to appreciate is MiniDBA . I was generously provided with a license to evaluate this and continue testing, and have recently had an actual chance to start using it more in my environment. The cost for MiniDBA is one of the most affordable I’ve found for a live monitoring tool with a good UI design (eye candy is critical for monitoring a server as we all know ) At the time of this post’s original date, there is a simple free version for monitoring a single instance on the machine running. This free version is awesome if you have a VM running full-time, as you could have it stay running and monitor the instance you care about. Paying $50 for developer and $100 for Enterprise gives you more flexible management with alerts, multiple servers, and a service to collect the data instead of having to run the GUI app the whole time.
wait stats
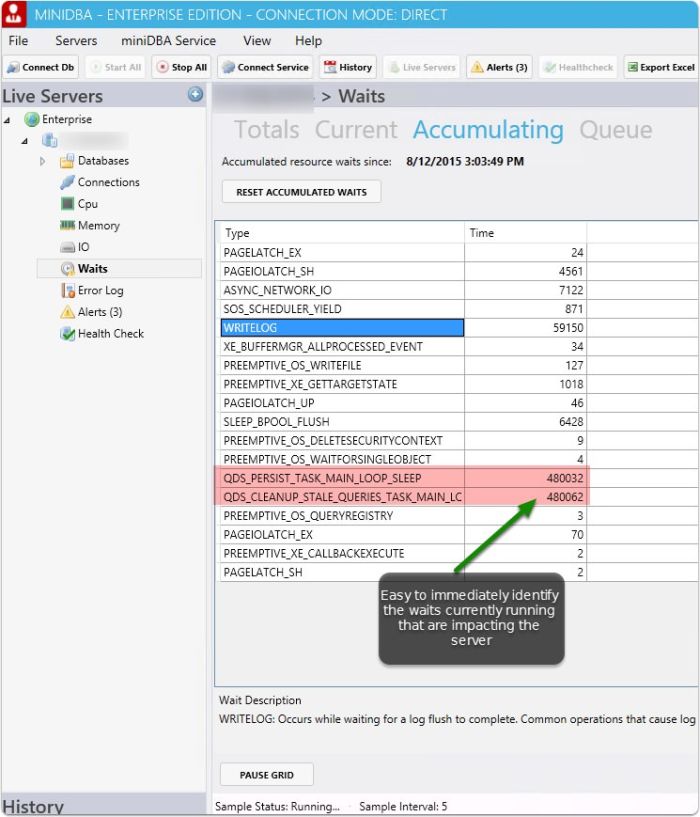
Wait stats are the first place to typically go to when analyzing the delays a server may face. MiniDBA offers a few cool ways of looking at the data, including getting the diff on waits since the point in time you started looking at it, helping isolate the waits that really matter to you right now.
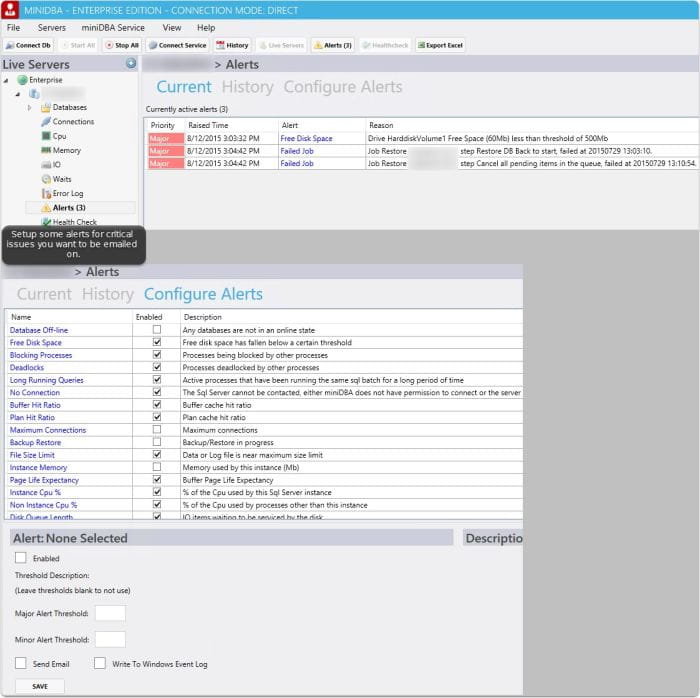
get alerts on critical server issues
I’d love to see this more extensible/customizable, but it’s a good start. The time “resolved” would also be great when reviewing the history to be able to see how long before an issue was resolved.
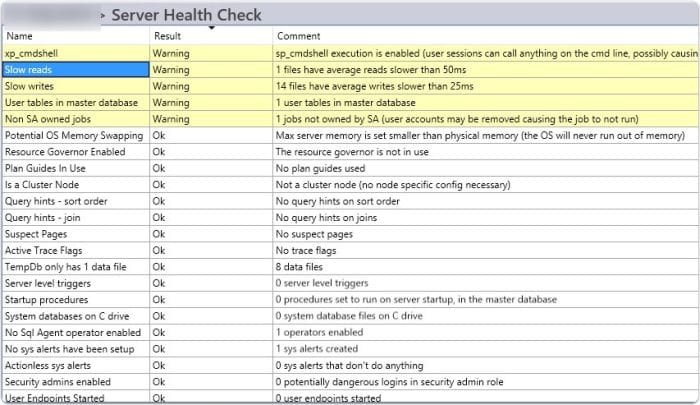
general healthcheck on “best practices”
Again, some really cool stuff in here. I’d love more customization opportunity to actually expand or customize these as I have a boatload of custom DMV’s for evaluating best practice setup conditions on a SQL server. It would be great to extend this more.
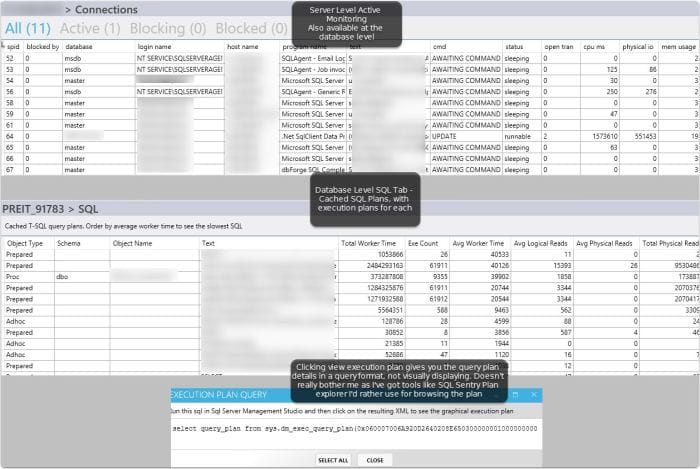
active connections
Pretty straightforward, but one plus is it offers ability to view the execution plan for each SPID, potentionally helping save a few steps. Note the execution plans are not shown at the server level “SQL tab”, but at the database level. This reminds me of a less thorough “sp_whoIsActive”.
other features
There are features to look at like:
- table sizes
- index sizes
- files in the database
- memory
- default trace
- last 3000 transaction log entries
- locks on objects.
visual monitoring
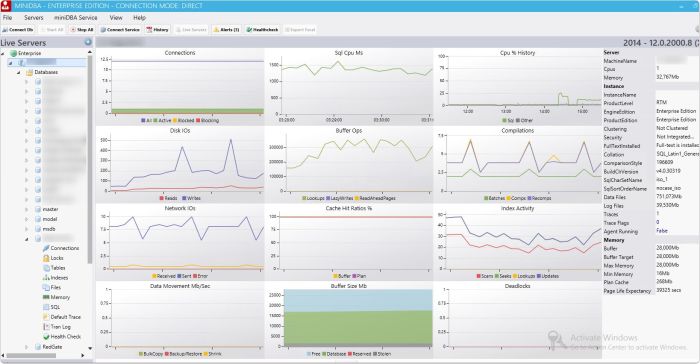
The key of course for a great monitoring tool is not just a bunch of text data thrown at you, but a great visual representation of various facts so you can easily identify something wrong. I think the developer did a great job in providing a useful “dashboard”. I think more customization or ability to look at a point in time more specifically would be great (like SqlSentry offers) but at the same time, the scope of the MiniDBA project seems to focus on simplicity, and not offering so much that it becomes complicated. I’d say for the price, the value is pretty good for a team looking for a simple tool with a few visual ways of looking at the performance, while still giving some active connection monitoring. Again, there’s a lot of other options out there for monitoring, even the built in functionality. But for value, this is a pretty good option, as it seems to focus on simplicity, usability, and not being a $1000+ per server license.
Webmentions
(No webmentions yet.)